F2F Class Notes October 25th (Ben)
a graph = a chart
a line graph/chart

This bar/line/pie chart shows the XXX from 2010 to 2016, breaking it down by A, B and C.
This line chart shows the amount of goods transported in the UK from 1974 to 2002, breaking them down by means of transportation.

This line chart shows the number of visitors per month┬аfrom June to September┬а2013, breaking it down by museum.
This bar chart shows the birth rate in 5 countries in 1970 and 2000.

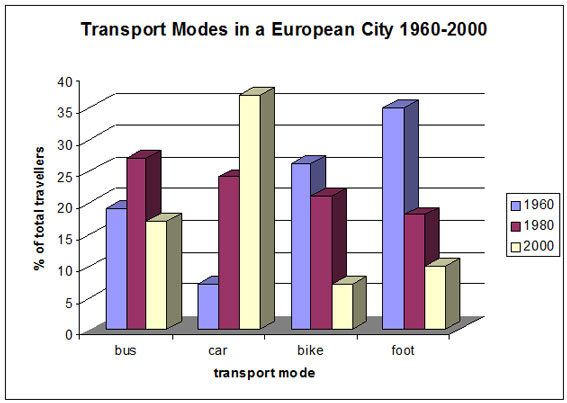
This bar chart shows the evolution of transport modes in a European City from 1960 to 2000, breaking it down by bus, car, bike and foot.
a ton = a tonne = 1,000 kg
a bar graph / chart
a pie chart
This bar/line/pie chart shows the XXX from 2010 to 2016, breaking it down by A, B and C.
This bar chart shows the evolution of employment rates in 6 countries from 1995 to 2005, breaking it down by country and gender.

- Increase, rise, grow
- Decrease, fall, drop
- Stay the same
A lot = sharply, significantly, suddenly
A little = slightly, gradually, progressively
More or less
According to this graph,┬аthe employment rate has sharply increased for both genders in every country over time, though┬аthe one┬аof females has remained significantly┬аinferior to that of males in every country.

According to this chart, the percentage of people travelling by bike and foot has sharply dropped over time, whereas the one of people travelling by car has very significantly risen and the one of people travelling by bus has more or less stayed the same.

Comments are closed.